The Data agent often leads to a common misconception:
Just ask a question directly, and AI will find the correct answer on its own.
For example:
“Why did the performance get worse this month?”
Sounds reasonable.
But this question actually hides many unclear points.
What exactly is:
Performance?
This month means:
Compared to which month?
Looking at all customers together?
Or:
New customers.
Existing customers.
Region.
Product.
Channel.
Broken down separately?
After finding possible reasons:
Are you just reviewing the information?
Or will you:
Directly inform your team?
Change a campaign?
Create a follow-up?
If these aren’t clarified first:
The AI might still provide:
Very comprehensive analysis.
The problem is:
It might not be answering the question you really want.
So today, you learn just one method.
Before analyzing with Data agent:
Write a:
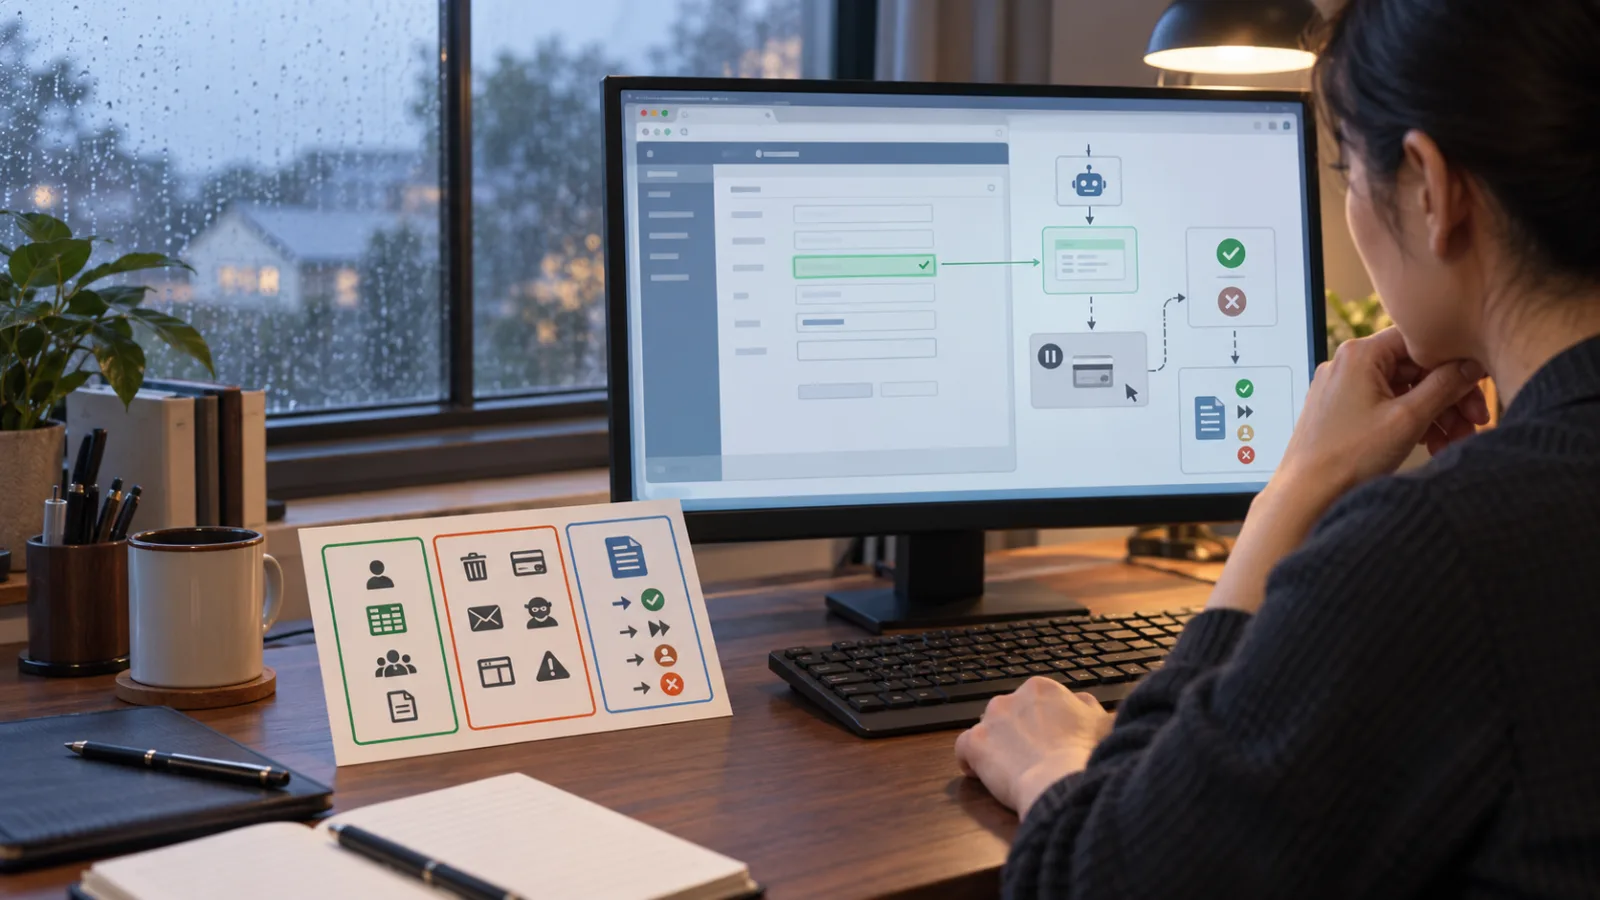
Four-box analysis card.
The four boxes are:
Metric.
Period.
Segmentation.
No immediate action.
Box 1: Define Which Number You’re Actually Checking
Suppose you ask:
“Why did Revenue drop?”
The first question is not:
Why?
But:
How does your company define Revenue exactly?
It could be:
Order creation amount.
Payment completion amount.
Before refund deduction.
After refund deduction.
Including tax.
Excluding tax.
Accounting-recognized revenue.
Different companies can have completely different definitions.
If the definition isn’t fixed first:
AI might pick:
Some plausible field it finds.
But that field:
May not be the company’s official KPI.
Even the Same “Revenue” Can Mean Different Things in Different Departments
Sales might look at:
Contract amount.
Finance might look at:
Recognized revenue.
E-commerce might look at:
Completed orders.
Marketing might look at:
Campaign attribution revenue.
All four figures might be called:
Revenue.
Therefore, before analysis, it’s best to specify directly:
“Please use the company’s official Semantic Layer’s definition of Net Revenue.”
If the company doesn’t have a Semantic Layer:
At least clarify which:
Dashboard.
Report.
Spreadsheet.
Will be the definition source.
Data Agent Supports Business Definitions Natively
This is a key reason the tool is especially worth exploring.
OpenAI’s design for the Data agent:
Doesn’t just allow AI:
To see a pile of tables.
It can also use:
The company’s own:
Metric definitions.
Custom calculations.
Data relationships.
And:
Semantic Layer.
Which means:
If a company has already defined clearly:
“What counts as Active Customer?”
“What counts as Churn?”
“What counts as Qualified Lead?”
AI can follow that.
But the premise remains:
You know which definition to use this time.
So Box 1 Can Be Very Brief
For example:
Metric: Net Revenue, according to Finance’s official definition, net of refunds.
Or:
Metric: Customer Retention, using the company’s existing Retention Dashboard definition.
No need for lengthy explanations.
Just turn vague terms into:
Verifiable terms.
Box 2: What Period Are You Comparing To?
Many flawed analyses don’t stem from miscalculations.
Rather, they come from:
Improper comparison methods.
For example, if you see:
Revenue this week:
Lower than last week.
AI might say:
It declined.
But last week happened to have:
A big promotion.
Then that comparison is unfair from the start.
Or, if you compare:
Monday to Wednesday:
Against:
The entire seven days of the previous week.
The numbers will naturally look bad.
So Box 2 Only Asks: Who Exactly Are You Comparing To?
For example:
This month vs last month.
This quarter vs last quarter.
September this year vs September last year.
Last 7 days vs previous 7 days.
Campaign period vs same-length base period.
Different questions require different comparison methods.
Don’t just say:
“Recently.”
Or:
“Before.”
Seasonal Industries Need Extra Care
Examples:
Mooncakes.
Travel.
School supplies.
Air conditioners.
Holiday meals.
If you compare September with August,
You might see big fluctuations.
But the proper benchmark is likely:
The same period last year.
Because:
Seasonality is inherently different.
AI won’t necessarily know:
Your business’s seasonality.
So don’t let AI guess the period entirely on its own.
Box 3: Which Segments to Analyze?
Suppose:
Revenue did drop by 10%.
This total figure alone:
Doesn’t hold much practical value.
You really want to ask:
Where did it drop?
For example:
Revenue dropped in Taipei.
Did not drop in Tainan.
Or:
New customers did not drop.
Existing customers did.
Or:
Physical stores didn’t drop.
Online dropped.
Or:
Product A is fine.
Product B dropped a lot.
This is segmentation.
Segmentation Turns a “Big Problem” Into a “Manageable Problem”
Saying:
“Revenue dropped.”
Is hard to act on.
But saying:
“Revenue decline is mainly in existing customers in the southern region for Product B.”
The next step:
Becomes much clearer.
You can then investigate:
Price?
Inventory?
Delivery?
Competition?
Customer service?
Product issues?
So the value of Data agent:
Is not just to tell you:
Total changed.
But to:
Break it down step by step.
But Don’t Start by Segmenting into 30 Dimensions
If you ask AI at the start to analyze by:
Region.
Age.
Product.
Channel.
Membership level.
Gender.
Campaign.
Salesperson.
Payment method.
Device.
All cross-analyzed,
You may end up with:
Lots of insights that look valuable.
But are actually just:
Random noise from small groups.
So for the first round,
Pick two or three of the most meaningful segments.
For example:
Region.
Customer type.
Product line.
That’s enough.
Box 4: No Immediate Action
This part is often overlooked.
Data agent can not only:
Analyze.
It might in the future also:
Send findings to Slack.
Email.
Or through connected tools:
Execute pre-approved actions.
This is an advantage.
But in the first analysis round:
Don’t let:
Findings
Immediately become:
Actions.
Because “Possible Cause” Is Not Yet a “Proven Cause”
For example, AI analyzes:
Retention dropped.
At the same time:
Support tickets increased.
Then suggests:
“Customer service issues may be impacting retention.”
This is a:
Hypothesis.
Not:
Proven causality.
If the next step is to:
Notify the entire customer service team:
“You caused customer churn.”
That’s too premature.
So a good Box 4 is:
“This round is for analysis and proposing next tests only. Do not send messages, change data, or take any external action.”
This sentence is very helpful.
The Complete Four-Box Card Can Look Like This
Suppose today you want to know:
Why did the renewal rate drop this month.
You can write directly:
Please analyze changes in Customer Retention for this month.

[Metric]
Use the company’s official definition of Customer Retention in the Semantic Layer.
Do not substitute with any other similar metric.

[Period]
Compare this month to the same number of days last month.
If noticeable seasonality exists, add the same period last year for a second comparison.

[Segmentation]
First segment by:
1. Region
2. New vs Existing Customer
3. Product Line
Do not add other segments unless you explain why.

[No Immediate Action]
This round is for analysis only.
Do not send emails, post on Slack, modify dashboard sources, create campaigns, or take external actions.

Please tell me:
- Which data sources were used
- Metric definitions applied
- Where the main changes are concentrated
- Which facts are confirmed
- Which are possible causes
- What the next verification step should be
This is the:
four-box analysis card.
Why Not Just Ask Directly: “Why Did Retention Drop?”
Because:
“Why” is a very broad question.
AI might have to decide on its own:
Metric.
Period.
Comparison.
Segmentation.
Source.
If the AI guesses all five:
Even if the analysis looks good at the end,
It’s hard to know:
Where the error began.
Defining the Four Boxes Reduces Investigation Space
One strong point of Data agent is:
It can:
Drill down step by step.
Ask follow-up questions.
Compare groups.
Check evidence.
But:
Just because it can check many things,
Doesn’t mean:
It should check everything in the first round.
The fewer:
Clear assumptions,
The easier it is:
To verify.
This is the same as with general AI agents.
It’s not that:
The stronger the capability,
The vaguer the prompt should be.
In fact, it requires:
Clear goals.
After Getting the First Results, Follow Up Further
For example, if AI reports:
Retention dropped:
Mainly among:
Existing customers.
In the eastern region.
For a certain product line.
Then start a second round.
Ask:
Has support ticket volume increased for these customers recently?
Has price changed?
Has delivery time lengthened?
Has product version changed?
Every step:
Builds on previous evidence.
This is called:
Investigation.
Not:
Asking AI once:
“Find me the real cause.”
Data Agent Can Continuously Follow Up in the Same Conversation
This design is very suitable for this kind of work.
First round:
Find out:
Where changes happened.
Second round:
Segment insights.
Third round:
Look for potential drivers.
Fourth round:
Compare evidence.
Finally:
Form more credible findings.
No need to:
Create a new report every time you ask a question.
But Always Watch Out That Definitions Don’t Change Unnoticed
For example:
In the first round:
You looked at:
Net Revenue.
In the second round, AI might add data by:
Quoting gross sales.
If you don’t notice:
The two charts might appear able to be combined.
But actually:
They’re measuring different things.
OpenAI’s own usage guidelines remind:
Users should confirm:
Source.
Time period.
Filter.
Metric definition.
These four points:
Are very close to today’s four-box analysis card.
If AI’s Results Differ from Company Dashboards, Don’t Rush to Ask Who’s Right
First compare:
Definitions.
For example:
Data agent shows:
Retention at 82%.
The official dashboard shows:
78%.
Don’t immediately say:
AI is wrong.
Nor:
The old dashboard is wrong.
First ask:
Are both sides using:
The same metric definition?
The same period?
The same filters?
The same customer population?
Many “number discrepancies” arise simply because:
Conditions differ.
This Shows Why Source Is Important
Data agent can connect to:
Data warehouses.
Drive.
SharePoint.
BI systems.
There’s a lot of data.
But:
More data doesn’t mean:
Every source is equally official.
There can be:
Draft spreadsheets.
Official financial reports.
Old dashboards.
New dashboards.
Test data.
If the company has a:
Source of truth,
It’s best to clearly tell AI:
Which to prioritize.
Small Companies Can Use the Same Method
You don’t need:
Snowflake.
BigQuery.
A dedicated data team.
To apply this technique.
If you only have:
Google Sheets,
The approach is the same.
Don’t ask:
“How is Facebook performing recently?”
Instead specify:
Metric:
Website clicks.
Period:
Last 7 days vs previous 7 days.
Segmentation:
Post type + whether a real person appeared.
No immediate action:
Don’t immediately change ads or schedule.
First:
Organize facts.
Then:
Suggest possible causes.
The same principle applies.
How Is This Different from Our Meta AI Lesson in August?
Back then we taught to:
After seeing AI analysis,
Divide results into:
Facts.
Hypotheses.
Next tests.
That is:
After analysis is complete.
To avoid mistaking correlation for causation.
Today’s lesson is about:
Before analysis starts.
Fix the:
Metric.
Period.
Segments.
Action boundaries.
The two methods:
Fit together well.
The Complete Process Has Only Six Steps
First:
Create the four-box analysis card.
Second:
Let Data agent find the data.
Third:
Confirm definition, period, filter, and source.
Fourth:
Find the segment with the largest change.
Fifth:
Classify results as:
Facts / Hypotheses.
Sixth:
Decide next tests.
Only then consider:
Whether to notify people.
Create dashboards.
Change campaigns.
Adjust workflows.
Don’t Be Fooled by Pretty Dashboards
Data agent can quickly build:
Beautiful.
Interactive.
Shareable.
Dashboards.
But the prettier the charts,
The easier it is for people to:
Believe them.
This is actually a risk.
The chart is:
Just a presentation format.
You should first confirm:
How numbers are calculated.
Where data come from.
Is the comparison fair?
Is the sample sufficient?
Is there real evidence for the cause?
The dashboard is:
The final packaging.
If It’s Just Internal Exploration, You Can Move Faster
For example:
You want to find out:
Which product is worth attention recently.
Let AI:
Quickly explore.
That’s fine.
But if the results are going to:
Board meetings.
Formal financial reports.
HR decisions.
Pricing changes.
Customer commitments.
You should:
Raise verification levels.
The same Data agent:
Can be used differently depending on risk levels.
Don’t use the same review system for everything.
“No Immediate Action” Doesn’t Mean Making the Agent Dumb
Some might wonder:
If Data agent can do:
Analysis → Action,
Why purposely pause?
Because:
The most valuable part of the first cause-finding round is:
Not speed.
But ensuring your direction is correct.
Wait until an analysis:
Has run many times.
Definitions are stable.
Dashboards are stable.
Actions have clear rules.
Then consider:
Connecting low-risk next steps.
This is:
Workflow automation.
For Example, Weekly Operations Reports Can Be Automated Step-by-Step
Week 1:
AI analyzes.
Humans review everything.
Phase 2:
Fix the four boxes.
Fix dashboard.
Humans look at exceptions.
Phase 3:
If a metric:
Exceeds threshold,
Prepare Slack drafts,
But don’t send.
With more maturity,
Consider auto-notifications upon approval.
This is much safer than:
Automatically notifying everyone right from day one.
This Is Why AI Workflow Diagnostics Are Truly Valuable
Many think:
Workflow diagnosis is just about:
Finding:
“Which tasks can be fully automated?”
But the more practical approach is:
First, find:
Steps that are:
Repetitive.
Clearly rule-based.
Have clear data sources.
Errors can be verified.
Then:
Only hand over those parts to AI first.
Data analysis:
Is the same.
First automate:
Data extraction.
Comparison.
Segmentation.
Evidence organization.
Then leave:
Cause judgment.
Business decisions.
Real actions.
To humans.
If Your Company Repeats the Same Weekly Analysis, It’s Even More Worthwhile to Delegate
For example:
Every Monday:
Admin exports data.
Analysts clean data.
Sales managers ask for reasons.
Analysts segment and redraw charts.
Then resend to the team.
If the weekly process:
Is almost the same each time,
The part that can truly be handed to AI first might not be:
“Making decisions for the manager.”
But rather:
The earlier part:
Finding data.
Running fixed comparisons.
Finding unusual segments.
Updating dashboards.
Organizing questions for confirmation.
Humans then only handle:
Which change really deserves action this time.
So Don’t Learn Ten Data Agent Commands First Today
Just remember the four boxes:
Metric
How is this number calculated exactly?
Period
Compared to which time period exactly?
Segmentation
Which meaningful groups should you break it down by?
No Immediate Action
First round is analysis only.
Don’t immediately turn possible causes into actual business actions.
By writing these four boxes clearly,
You’ve actually completed:
Half the quality control of your analysis.
Because the greatest risk is not:
That AI can’t calculate.
But that:
It calculates a vague question very precisely for you.
If you want to know which steps in your work are best to hand over to AI first, comment “Process” and I can help you figure out where to start.
Today, let’s improve a bit together with AI.
Learn one AI skill daily.
Save a little time daily.
Boost your ability a little more every day.
SasaDaily, growing with you.